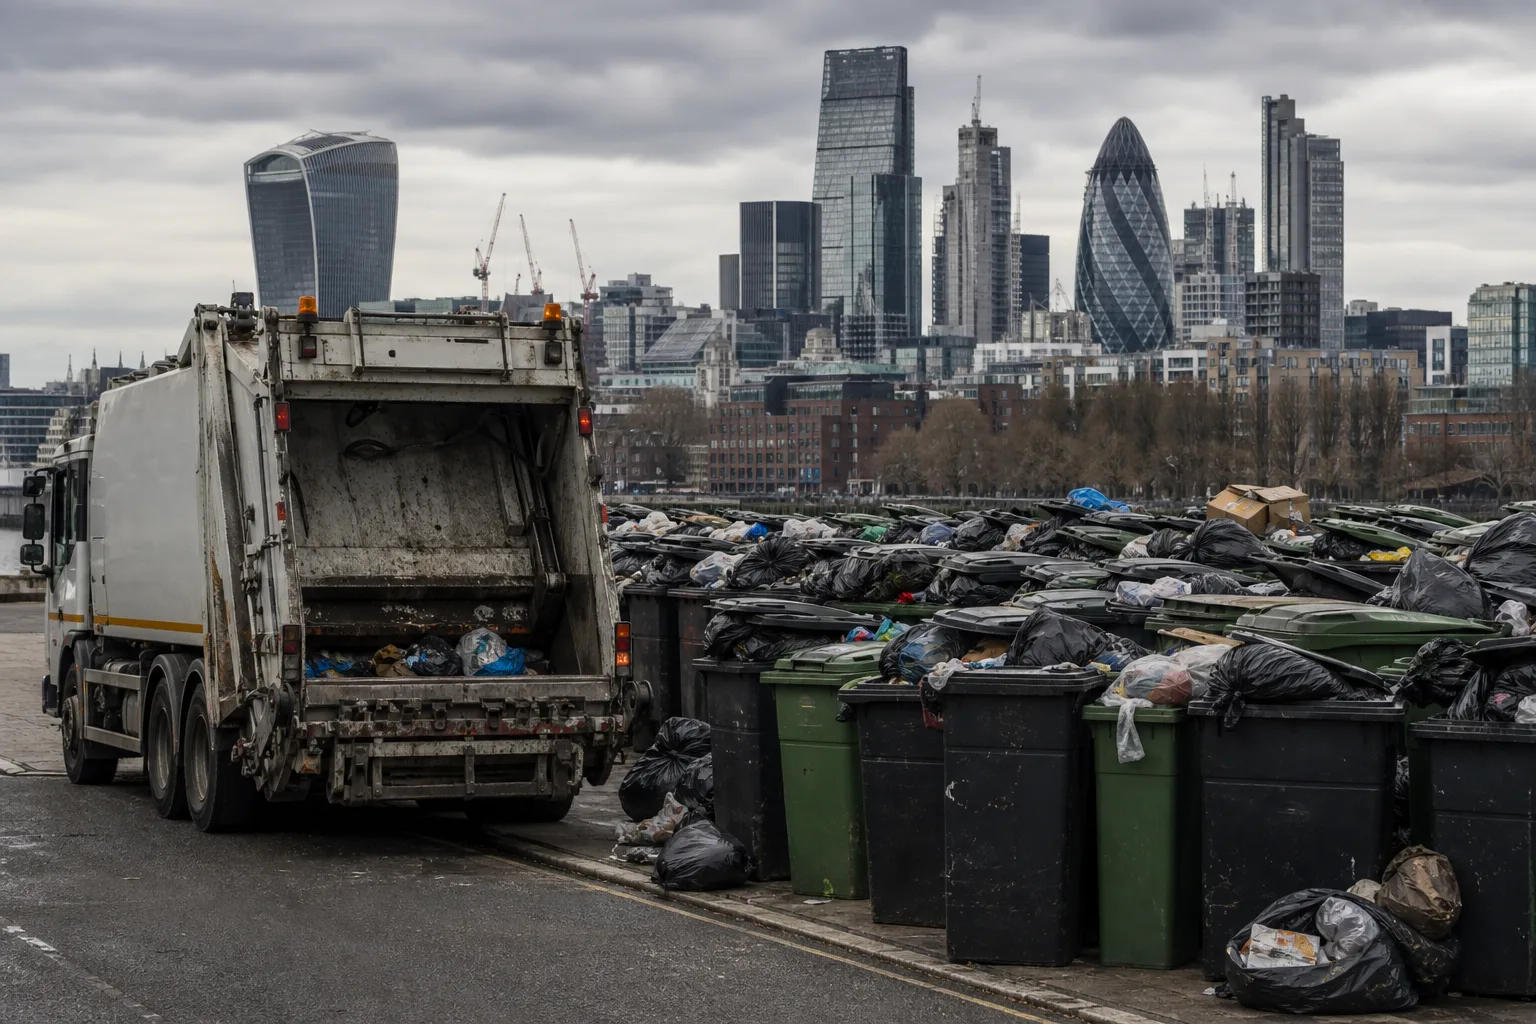
London produces well over 3 million tonnes of local authority collected waste each year—roughly 7,000 tonnes every day across 33 boroughs when commercial and construction streams are included. That equates to kilograms per resident per day split between recycling, food waste, general refuse, and bulky items. These numbers explain collection frequency, fleet size, and why contamination in one estate can waste a whole lorry load.
Scale of London's Daily Waste
GLA and Defra statistics show municipal waste arisings divided by population and days in year. Inner boroughs generate less weight per household than outer zones with gardens and cars—yet higher density means more collection miles per tonne. Westminster's commercial waste dwarfs domestic tonnage due to shops, offices, and hospitality.
Recycling rates vary from below 30% to above 50% by borough, reflecting housing type, wealth, and service design. Flats with communal bins typically recycle less than kerbside houses—not because residents care less, but because shared responsibility dilutes effort and contamination rises.
Composition of a Typical Day
Food waste collections spread across pilot and full-service boroughs capture peelings and leftovers for anaerobic digestion. General waste still carries non-recyclable plastic film, absorbent hygiene products, and contaminated packaging. Dry recycling peaks after weekend deliveries—Monday cardboard surges clog storage cupboards until collection.
Bulky waste—mattresses, furniture, white goods—does not ride daily rounds but still arrives at HWRCs and fly-tipping hotspots daily. Construction waste from refits in terraced streets is often booked separately through skip hire or private carriers.
Costs and Logistics Behind the Numbers
Each tonne collected includes labour, fuel, MRF gate fees, landfill tax, or incineration charges. Narrow Victorian streets require smaller vehicles and more trips. ULEZ and low-emission zones push fleets toward electric RCVs on longer procurement cycles.
Rejected recycling loads convert valuable material into disposal cost overnight—economically equivalent to throwing cash in the general waste stream. Boroughs publish contamination percentages; a few percentage points improvement saves millions annually across London.
Night-time commercial collections in the West End keep daytime streets clear but concentrate noise and diesel exposure debates—electric RCV pilots target these routes first. River and rail barge trials for bulk transfer occasionally move waste eastward away from road miles, though most tonnes still travel by truck to Essex and Kent facilities.
Street cleansing teams pick up litter separately from household rounds—Central London tonnes from bins on pavements add to totals beyond kerbside statistics residents see on council dashboards.
Trends Shaping Tomorrow's Statistics
Deposit return schemes may pull high-value bottles from household recycling, changing MRF income. EPR packaging fees aim to cut unnecessary material at source. More food waste mandates will shift weight from general bins to AD plants, lowering methane from landfill but requiring new caddy logistics in dense blocks.
Population growth in east London and Thames corridor developments adds thousands of homes—waste plans must scale collection storage in buildings at planning stage, not after residents move in.
Waste tonnage alone does not measure success: kilograms per capita falling while recycling rises indicates prevention working. GLA monitoring tracks both generation and diversion—boroughs with falling residual waste per person often credit food waste rollout and furniture reuse partnerships.
Commercial waste data is harder for residents to see but dominates City of London and Westminster statistics—office strip-outs and retail packaging drive night-time collection fleets distinct from domestic rounds.
How This Works in London
Borough-level data matters more than city averages. Hackney reports recycling and residual tonnages in annual environment reports—useful for estate managers benchmarking contamination. Camden mixes high student turnover with affluent terraces, producing distinct seasonal peaks at term end.
When daily bin capacity fails—post-move cardboard, shop fit-outs—our rubbish removal services supplement borough capacity legally. Full borough list on areas covered.
How This Works in Birmingham
Birmingham's single-city scale rivals a London borough but with more kerbside houses and fewer ultra-dense cores. Daily tonnage scales with 1.1 million residents; HWRC throughput spikes Saturdays. Comparing Birmingham per-capita waste with London highlights how garden waste and car access change composition.
Regional disposal contracts differ from London's fragmented market. Context for collections on our Birmingham area guide, Selly Oak rubbish removal.
How This Works in Manchester
Greater Manchester publishes combined authority waste data—nine boroughs aggregated for recycling rate reporting to government. Daily tonnes include trade waste collected under municipal contracts in some areas. Apartment growth in city centre wards pushes down recycling rates unless bin stores are designed for separation.
Comparing Manchester with London shows similar policy tools—food waste, contamination campaigns—applied across different urban fabrics. Local detail on our Manchester area page, Didsbury rubbish removal.
Frequently Asked Questions
How much waste does London produce daily?
Greater London generates thousands of tonnes daily from households, businesses and construction combined.
Which London boroughs produce the most waste?
Densely populated inner and west London boroughs with high commercial activity typically rank highest per day.
How does London compare to Manchester?
London's absolute volume is far larger, but per-capita waste can be similar when flats and commercial waste are included.